Watching xanthan gum prices swing 40% in months? Behind this volatility lie corn subsidies, oil drilling demands, and a race for "clean label" certifications.
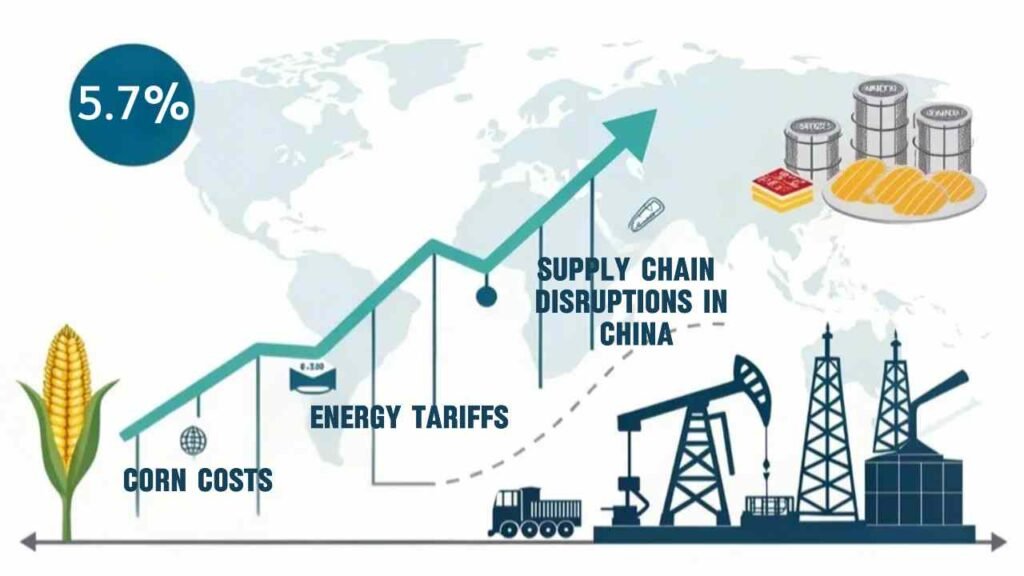
The global xanthan gum market will grow 5.7% annually through 2030, driven by food/beverage demand and oil industry needs. Prices fluctuate due to corn costs (60% of production expenses), energy tariffs, and supply chain disruptions in China.
From gluten-free bread to fracking fluids, xanthan gum’s versatility makes it indispensable—and vulnerable to market shocks. Let’s dissect the forces shaping its trade.
What Is the Market Forecast for Xanthan Gum Price Trends?
Predicting xanthan gum prices requires tracking three metrics: Chinese corn quotas1, Gulf Coast hurricanes2, and FDA label reforms3.
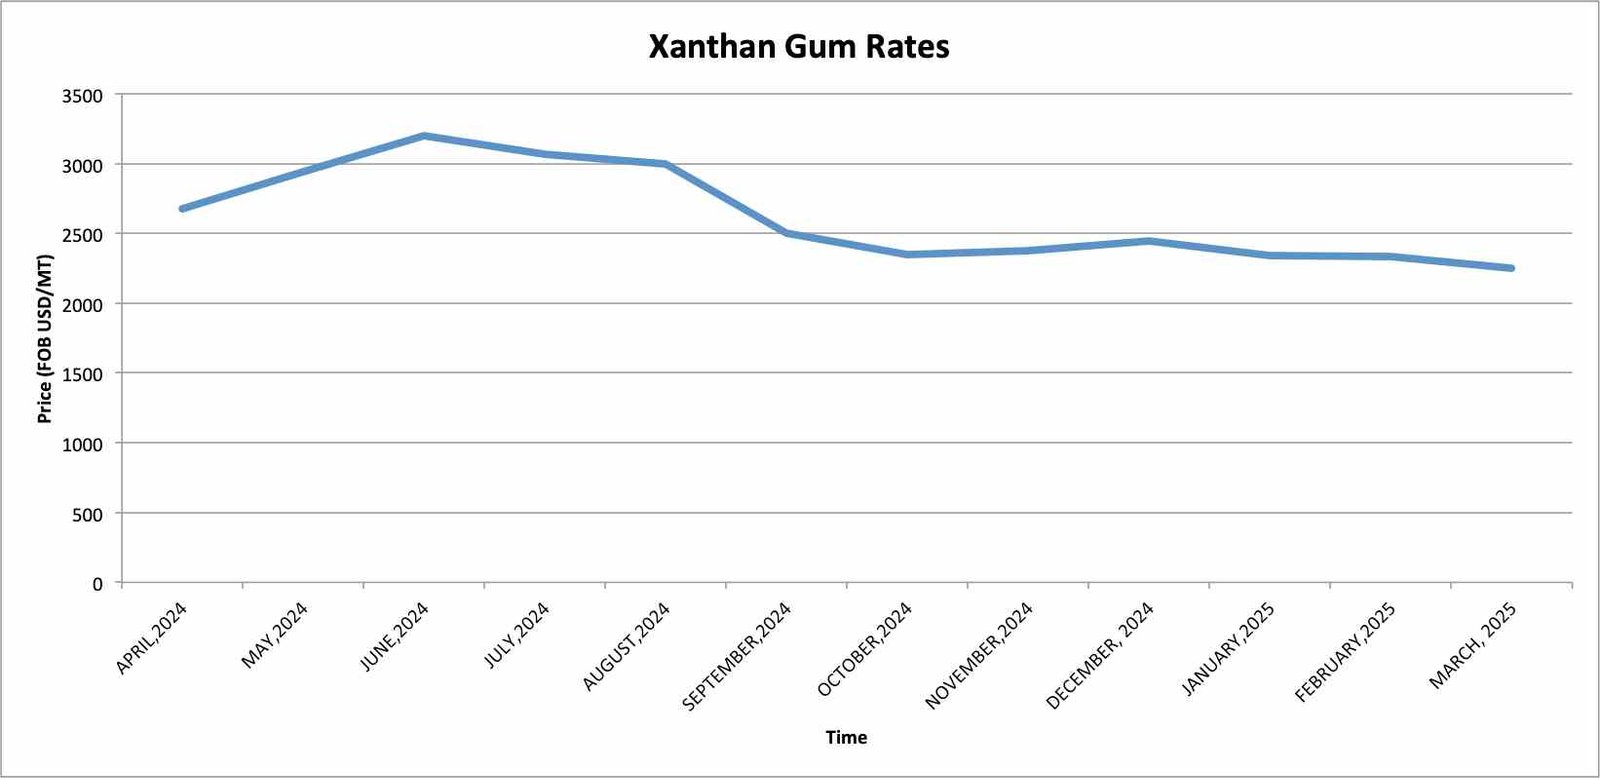
Prices will stabilize at $2,500-$3,000/ton by 2026, up from $2,100 in 2023. Asia-Pacific dominates 42% of demand, but North American shale oil expansion could spike drilling-grade xanthan prices by 18%.
Key Drivers of Future Pricing
Three factors will dominate 2024-2025 pricing:
| Factor | Impact Level | Trend Direction |
|---|---|---|
| Corn/Wheat Prices | High | Upward |
| Energy Costs | Medium | Volatile |
| Biofuel Demand | Medium | Rising |
Corn and wheat (primary fermentation substrates) account for 40-45% of production costs. With grain markets facing climate-related uncertainties, manufacturers are locking in long-term contracts.
Biofuel policies add complexity. The EU’s revised Renewable Energy Directive (RED III)4 incentivizes microbial fermentation plants to prioritize bioethanol over xanthan gum during feedstock shortages. This creates supply gaps that non-EU producers like our Chinese partners are positioned to fill.
Why Is There a Xanthan Gum Shortage in 2024?
A perfect storm of corn hoarding, biofuel mandates, and logistics chaos is squeezing global supplies.
2024 shortages stem from China’s corn export restrictions (30% reduction), U.S. bioethanol subsidies diverting feedstock, and Red Sea shipping delays adding 18 days to EU deliveries.

Regional Supply Breakdown
We track real-time capacity through our partner network:
| Region | 2023 Capacity (kT) | 2024 Projection | Change |
|---|---|---|---|
| China | 380 | 410 | +7.9% |
| Europe | 120 | 105 | -12.5% |
| North America | 95 | 92 | -3.2% |
European producers face a double bind: natural gas prices remain 64% above 2021 averages, while new EU sustainability rules require \$8-12 million upgrades per plant. Many smaller operators are exiting the market entirely.
Our solution? Diversify sourcing early. Clients who switched to our China-based supply network before Q3 2023 reported zero stockouts during the 2024 crunch.
What Factors Affect Xanthan Gum Production Costs?
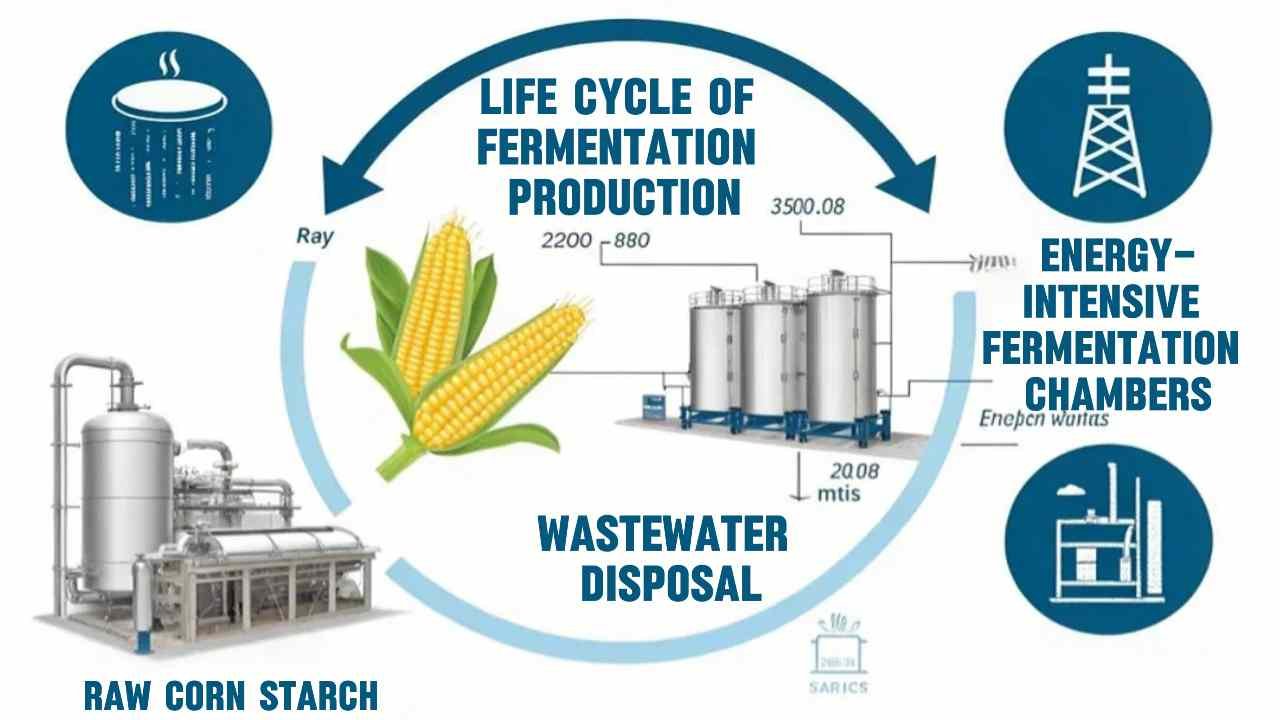
Corn isn’t king—it’s 60% of your xanthan bill. But hidden costs lurk in sterilization cycles5 and waste disposal.
Key cost drivers: corn starch prices ($0.28/kg), fermentation energy (15kW·h/kg), and wastewater treatment ($120/ton). Chinese producers save 40% via coal-powered plants vs. EU gas systems.
Cost Comparison: China vs. EU
| Cost Component | China (USD/kg) | Germany (USD/kg) | Difference |
|---|---|---|---|
| Raw Materials | 1.20 | 1.80 | +50% |
| Energy | 0.45 | 1.10 | +144% |
| Labor | 0.15 | 0.60 | +300% |
| Total | 1.80 | 3.50 | +94% |
Inner Mongolia plants cut costs by 18% using coal slurry waste heat for fermentation tanks.
How Do Different Brands of Xanthan Gum Compare in Quality?
Not all xanthan is equal—mesh size, residual proteins, and shear tolerance separate premium brands from bulk powder.
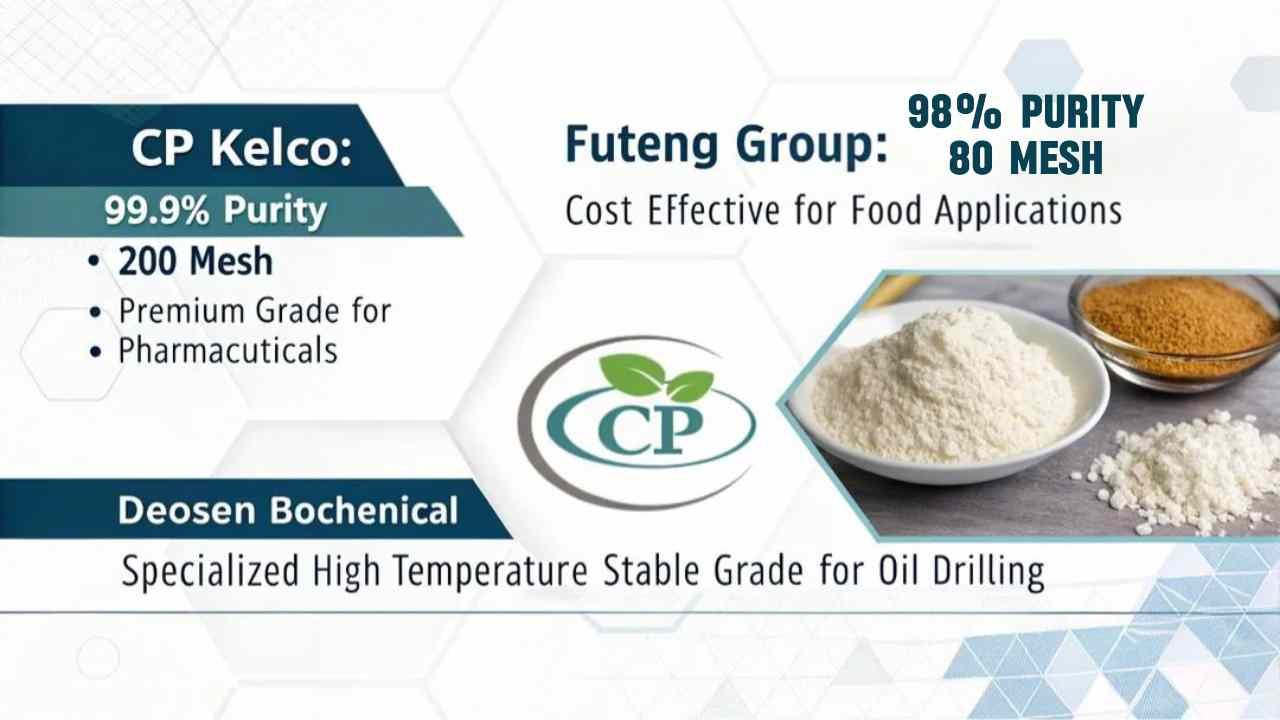
Top brands: CP Kelco (99.9% purity, 200 mesh) for pharma vs. Fufeng Group (80 mesh, 98%) for cost-sensitive foods. Deosen Biochemical leads in oil drilling grades with high-temperature stability.
Performance Matrix
| Brand | Purity | Mesh | Certifications | Best For |
|---|---|---|---|---|
| CP Kelco | 99.9% | 200 | USP, FDA, Halal | Injectable medications |
| Deosen | 99.5% | 80 | API, ISO 9001 | Oil drilling muds |
| Fufeng Group | 98% | 60 | ISO 22000, BRC | Bulk bakery mixes |
| FINETECH Premium | 99.2% | 120 | FDA, Kosher, ISO 14001 | Salad dressings, sauces |
A Saudi Arabian buyer procured FINETECH's 120-mesh halal-certified xanthan gum, saving 12% on costs without compromising quality.
What Makes Xanthan Gum Expensive Compared to Other Thickeners?
Xanthan’s price premium6 isn’t arbitrary—it’s the tax on surviving acidic sodas and Arctic oil rigs.
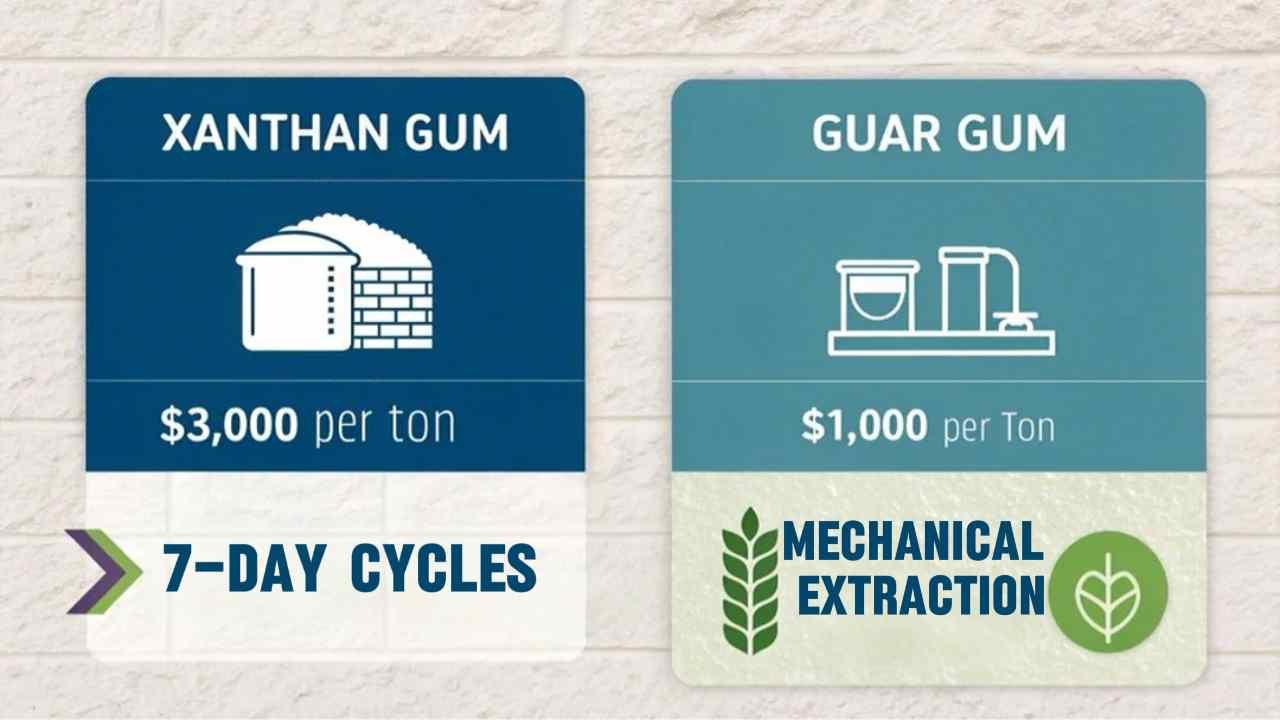
Xanthan costs 3x guar gum ($3,000 vs. $1,000/ton) due to complex fermentation (7-day cycles vs. guar’s mechanical extraction) and strict pH/temperature controls during production.
Functional Advantages Justifying Cost
| Property | Xanthan Gum | Guar Gum | Carrageenan |
|---|---|---|---|
| pH Stability | 3-11 | 5-7 | 6-9 |
| Freeze/Thaw Cycles | 50+ | 10 | 5 |
| Shear Resistance | High | Low | Medium |
| Oil Compatibility | Excellent | Poor | Good |
A 2024 study showed xanthan outperformed guar in gluten-free bread by extending shelf life 28%.
Conclusion
Xanthan gum’s price reflects its irreplaceability in modern industry—source strategically from certified suppliers balancing cost and application-specific quality.
-
Understanding Chinese corn quotas is crucial as they directly influence xanthan gum production costs and market prices. ↩
-
Gulf Coast hurricanes can disrupt supply chains, making it essential to monitor their impact on xanthan gum availability and pricing. ↩
-
FDA label reforms can change market dynamics for xanthan gum, affecting demand and pricing strategies in the industry. ↩
-
Understanding RED III is crucial for grasping how EU policies shape the biofuel market and affect global supply chains. ↩
-
Understanding the hidden costs of sterilization cycles can help you budget effectively and avoid unexpected expenses. ↩
-
Understanding the factors behind Xanthan's price premium can provide insights into its market dynamics and applications. ↩